

Scan 8,000 vines per hour.
All day, every day, any vehicle.




Exclusively for winegrowers
40 scanners
deployed on 3 continents.
8,000 vines
profiled per scanner, every hour.

What the scans tell you
about disease, pruning, yield and land

Mildew, botrytis, esca symptoms, and red leaf detection.
Mildew on leaves and bunches, botrytis, esca symptoms, and red leaves pinpointed to exact vines with evidence images for proof.
Map incidence and spread to target eradicants and avoid reactive treatments.
Capture evidence to de-risk winery penalties and support picking decisions.
Send crews to exact rows to fruit drop and hit quality targets.
Accurate pruning counts for cane and spur vines.
Pruning quality percentage vs. your expected targets for every single vine.
Identify top performing pruners and re-train others as needed.
Use bud counts to hit yield targets with minimal in-season intervention.
Determine your shoot-thinning strategy with buds per vine, cane, and spur.


Improve your yield estimates from bud to bunch
Accurate inflorescence counts in spring and bunch counts in summer.
Plan your thinning, harvest logistics, and winery commitments on real counts.
Use cluster heatmaps to put resources exactly where they’re needed.
Put every square foot of land to work.
Map and catalogue every missing and dead vine.
Get missing & dead vine counts for nursery orders.
Pinpoint replants and easily tend to them year-round.
Send crews directly to the exact rows to replant, restake, or repost.

From scans to insights overnight
The scanner
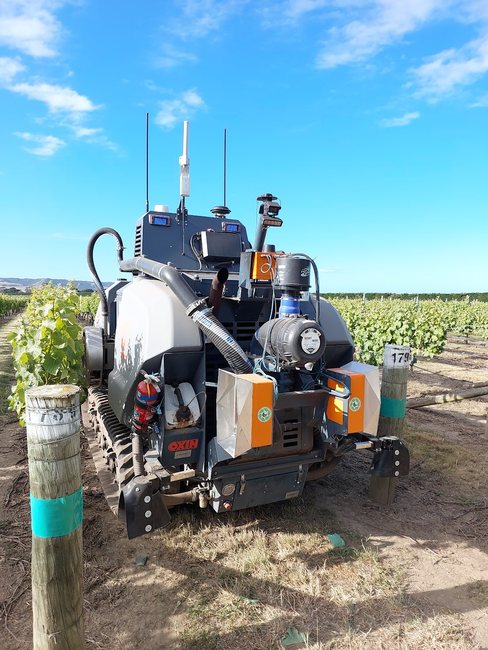
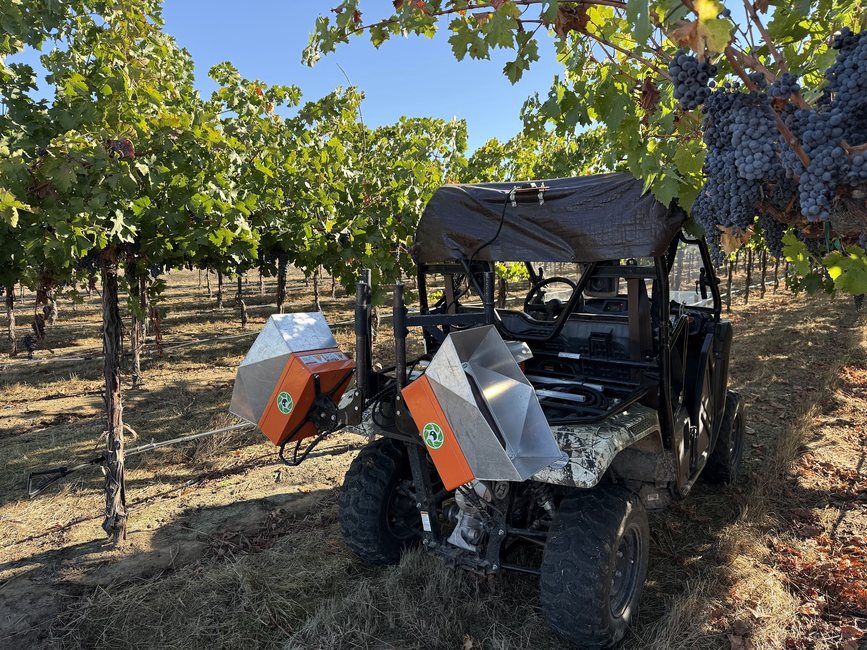
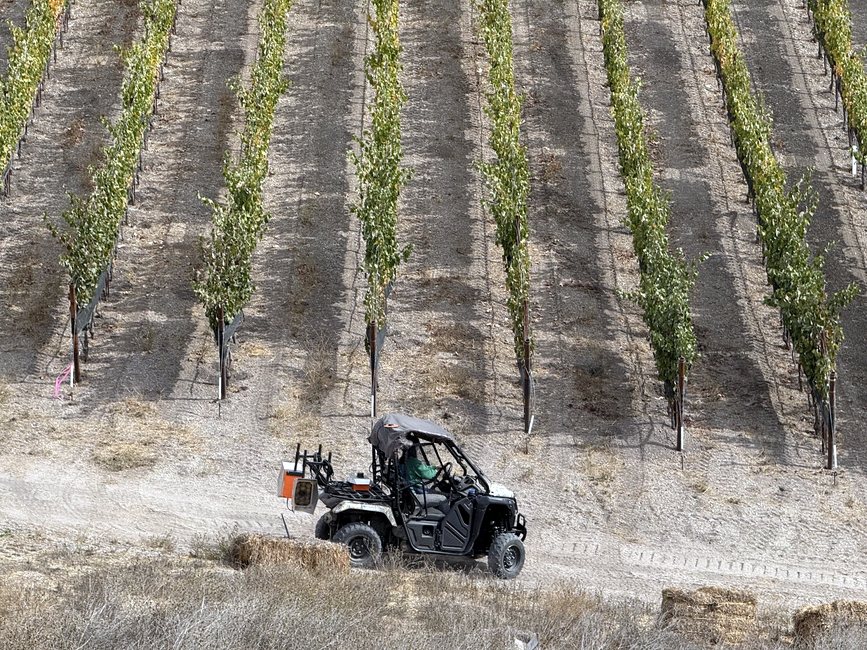
Our scanner takes 50,000 high-quality images of your plants every hour as you drive by. It sees what you would see in the field: buds, bunches, even a single mildew spot on a lone leaf.
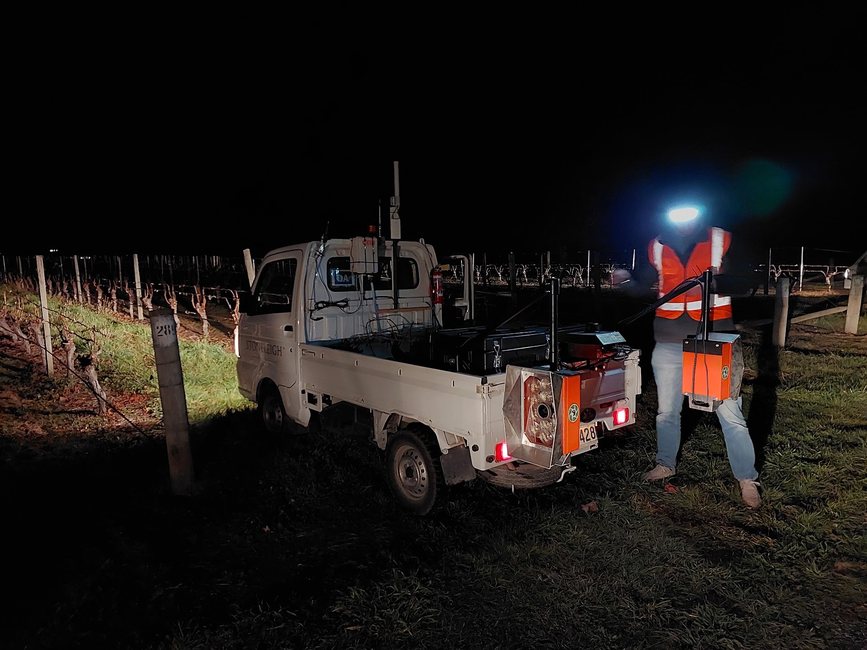
What makes the scanner special is our patented light system. It removes sunlight and harsh reflections, so every image comes out true to life at any time of day and in any weather.
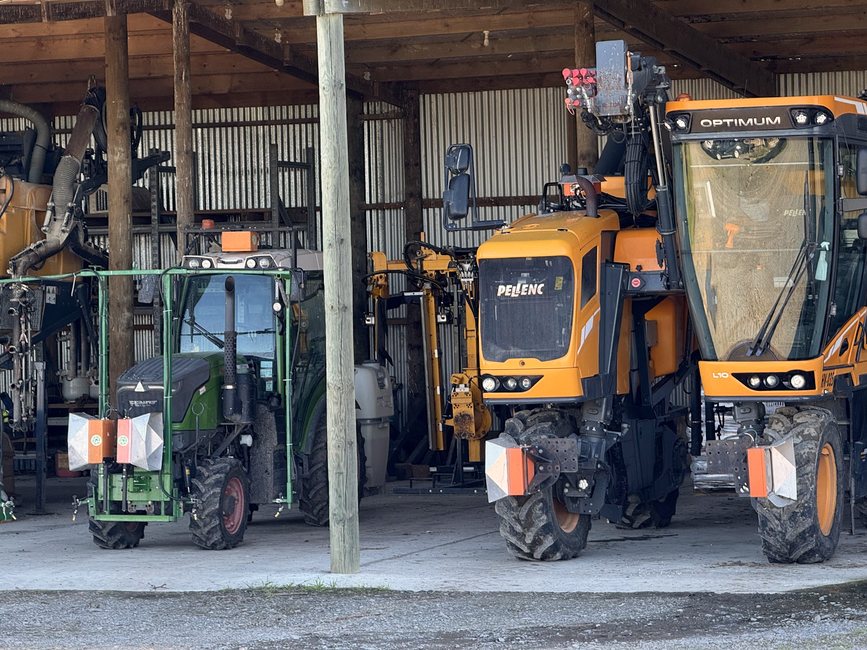
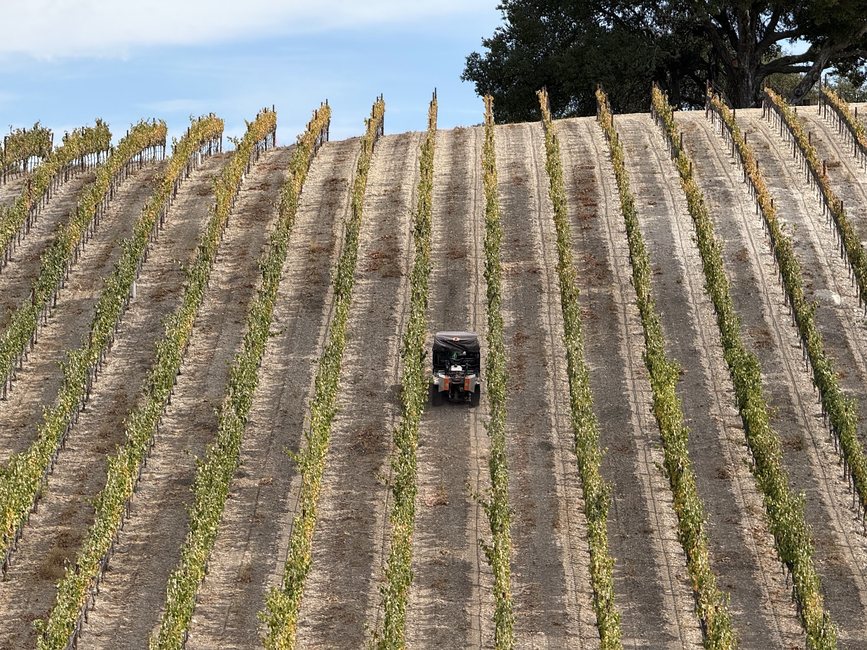
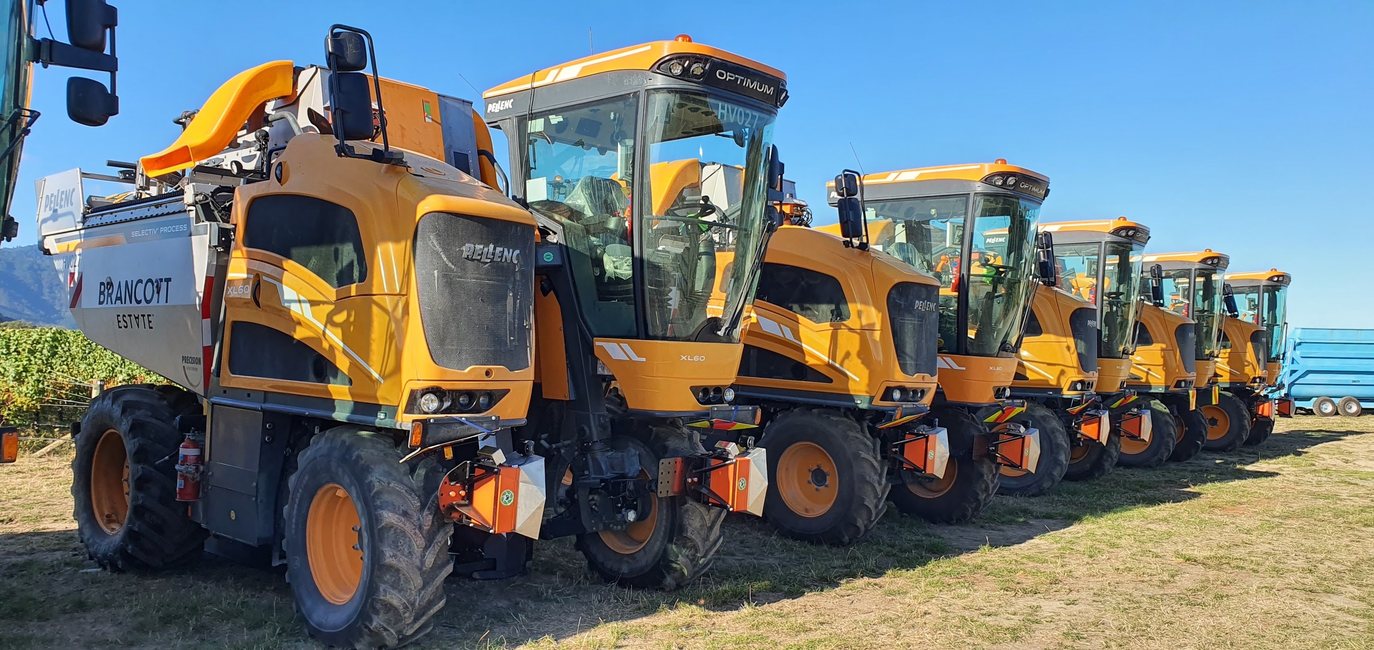
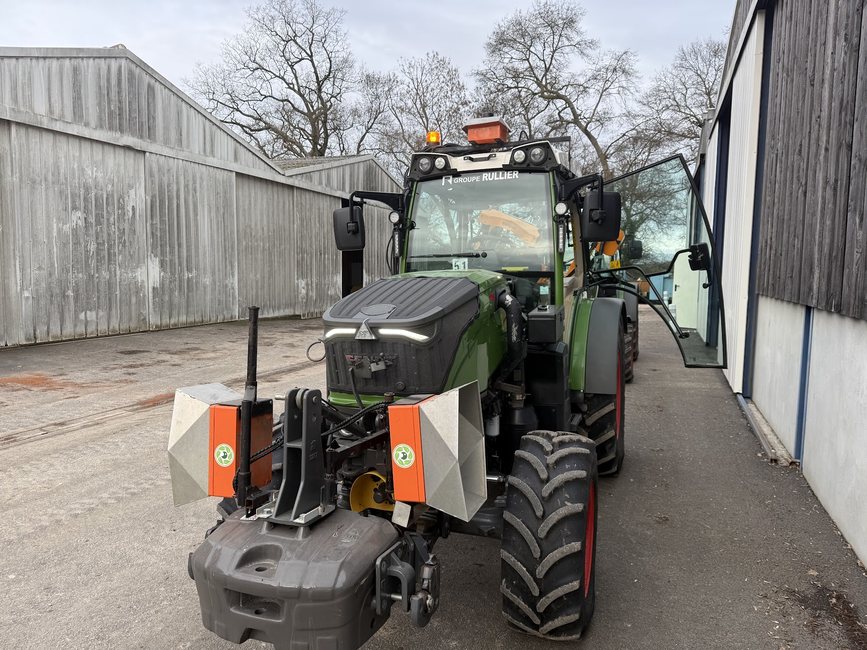
The scanners are installed on your vehicles and run automatically with no operator intervention.


On-board real-time AI
Each scanner analyses up to 8,000 vines an hour, tagging each one down to an inch.
This means that every time you drive by, the scanner already knows every plant and updates its profile automatically, while your operator gets on with the job.
There are no hard drives to deal with or massive data uploads that take days to finish. Your results are available before the next morning.

Our grower portal: Osiris™
Our grower portal, Osiris™, is where you see your data, and it keeps improving with feedback from viticulturists around the world.
Dashboards, maps, evidence images, charts, and exportable reports cover every scanned vine, row, and block. Every scan adds to a record of your vineyard that keeps each vine’s history vintage after vintage.
Your team uses it to decide where to send people, what to spray and where to replant. Cropsy does the scanning and the analysis; your team makes the calls.